|
Spatial Modeling |
|
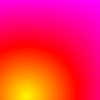
| HOME | Modeling spatial data is not difficult in Noobeed. In general, an Image object object can be used to store any kind of spatial data, with or without map projection information. The simplest way is to create an image with an appropriate size, no of rows and columns, then add to its corner points x y coordinates, and it will be ready to work. The following example is a program written in Noobeed to calculate altitude angle of the sun on a particular day, at a specific time. A blank image is created with a size of 100 x 100, then it spatial information is added. Here the lower left point is having a coordinate of x = 0, and y = 0. We assume that x coordinates pretend to be longitude and y coordinates pretend to be latitude. The other corners are having a coordinate of x = 80, y = 80, hence latitude = 80 degrees and longitude = 80 degrees. Now the job is to fill up all the pixel, having its own coordinate on the earth, with the altitude angles of the sun observed at each pixel at a given time. The result image, variable "a", is made an RGB image with a color map "HOT" to show the variation of altitude angle of the sun. We needs a "Sun" object to this this job. The Noobeed code is simple, as follows.
Here is the result in an RGB tif file, with a "HOT" colormap. Remember that the image is only 100 x 100 pixels, and that is why its looks tiny.
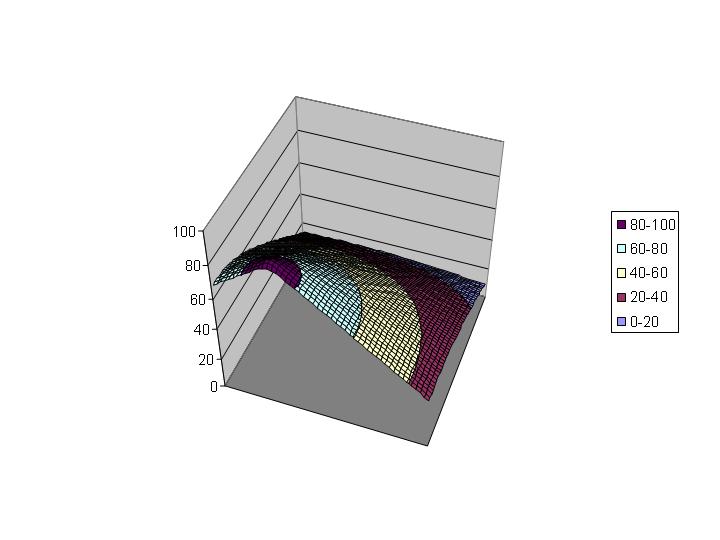
We could also export the data into other visualization package. Here we save the content of "a" in the ASCII format, and import into MS Excel to make a surface plot. The result is as follows.
| HOME | |