| HOME |
Using Noobeed to transform map projection and
geographic coordinates back and forth are just one command away in the
interactive mode. If writing a program, Noobeed can almost handle any type
and format of data for any number of points. From time to time, the
function "deg" and "dms" are found very handy when dealing with non-decimal
degree angles.
Not only Noobeed can transform coordinates
between geographic and map projection system, it can also transform coordinates
between different map projections and different geodetic datum by using just one
single command. Thank to the designing of the Projection class that an
Ellipsoid object is always embedded in a Projection object.
Suppose a point in New Mexico, having a state
plane coordinate of
- X = 531407.353 and Y = 139269.107, is going to
be converted to geographic coordinate.
- The state plane coordinate is a Transverse
Mercator (TM) projection, with an origin at latitude 31 N degree and longitude
106 W degree, and a scale factor at central meridian of 0.9999. The
false origin is X = 500,000 and Y = 0.
- The ellipsoid is Clarke 1966, (a = 6378206.4
and f = 1/294.9786982)
First we start off with declaring an ellipsoid,
as follows.
->My_ellipsoid = Ellipsoid()
->My_ellipsoid.a() = 6378206.4
->My_ellipsoid.f() = 1/294.9786982
Since ellipsoid Clarke 1966 is one of the
pre-defined ellipsoids in Noobeed, we can also do the following.
->My_ellipsoid = Ellipsoid()
->My_ellipsoid.set("Clarke66")
Next we create a Projection object and set the
specific ellipsoid to it.
->P = Projection()
->P.ellipsoid() = My_ellipsoid
Then we set the projection object to Tranverse
Mercator by using the function "setTM".
->P.setTM(31,-106,0.9999,500000,0)
The first argument in function "setTM" is
latitude of origin, followed by longitude of origin, scale factor at central
meridian, and false origin in x and y.
Now it's time to convert a map projection
coordinate to geographic coordinate.
->lat_lon = P.xy2geo(531407.353,
139269.107)
->print dms(lat_lon.x(), 5)
32 15 20.72951
->print dms(lat_lon.y(), 5)
254 19 59.99142
->
The variable "lat_lon" is a Pt2D object, thus we
extract latitude and longitude from its x and y member data. The dms is to
convert from decimal degree to degree minute second format.
We can check the result by convert the latitude
and longitude back to the map projection coordinate, as follows.
->XY = P.geo2xy(lat_lon.x(), lat_lon.y())
->print XY
( 531407.353 , 139269.107)
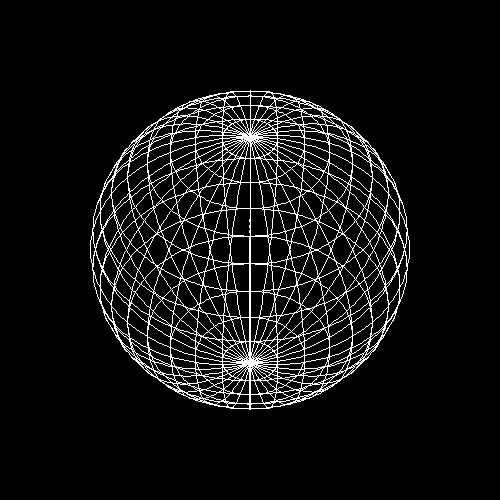
The following is another example of Noobeed program to
plot the projection of latitude and longitude lines. They are drawn on an
Image_uch object, "A", which is finally saved as a TIF file for visualization.
/ proj is a "Projection"
object, set as an orthographic map projection,
/ in an oblique aspect, center at lat = 45N deg and lon = 0 deg
proj = Projection()
proj.setorthgph(45,0,0,0)
/ range of latitude and longitude being plotted
lat1 = -90
lat2 = 90
lon1 = 0
lon2 = 360
/ range of x y map projection coordinates being plotted
min_x = -10000000
min_y = -10000000
max_x = 10000000
max_y = 10000000
no_row = 500
no_col = 500
/ A is an "Image_uch" object for output, its size will be 500 x 500
A = Image_uch(no_row, no_col, min_x, min_y, max_x, max_y)
/ Generate two matrices, containing latitude and longitude
values
Lat = Matrix()
Lat.lingen(lat1, lat2, 10)
Lon = Matrix()
Lon.lingen(lon1, lon2, 2)
n1 = Lat.ncol()
n2 = Lon.ncol()
/ ** now plot the projection of LATITUDE lines
for i=0, n1-1
lat = Lat(0,i)
lon = Lon(0,0)
pt1 = proj.geo2xy(lat, lon)
for j=1, n2-1
lon = Lon(0,j)
pt2 = proj.geo2xy(lat, lon)
A.drwline(pt1.x(), pt1.y(), pt2.x(), pt2.y())
pt1 = pt2
end
end
/ ** now plot the projection of LONGITUDE lines
for i=0, n2-1
lon = Lon(0,i)
lat = Lat(0,0)
pt1 = proj.geo2xy(lat, lon)
for j=1, n1-1
lat = Lat(0,j)
pt2 = proj.geo2xy(lat, lon)
A.drwline(pt1.x(), pt1.y(), pt2.x(), pt2.y())
pt1 = pt2
end
end
A.savetif("plot_orthgph")
|
Here is the result, "plot_orthgph.tif".
| HOME | |